Spectral Uplifting: Comparing Wavelength Sampling Strategies
An interactive C++ sandbox that turns measured light and reflectance spectra into color, comparing fixed buckets, random Monte Carlo and hero wavelength sampling against ground truth.
$ git clone https://github.com/XanderBert/SpectralUplifting- Topic
- Spectral sampling
- Data
- CIE A · D65 · F11, X-Rite patches
- UI
- Dear ImGui · ImPlot
Most renderers work in RGB, but light is a spectrum. A spectral renderer has to answer the same question for every pixel: given the light that arrives and the surface it bounces off, what color does the eye see? This project is a small playground to compare how different sampling strategies answer that question, and how fast.
From spectrum to color
The color of a surface under a light is an integral over the visible range, 380 to 780 nm. For each wavelength, the illuminant’s power is multiplied by the surface’s reflectance and weighted by the three CIE color matching functions. That gives the XYZ tristimulus values, which are then converted to sRGB.
The data is all measured:
- Illuminants: CIE A (incandescent), D65 (daylight) and F11, a fluorescent lamp with very narrow emission spikes.
- Reflectances: six X-Rite color checker patches.
- Observer: the CIE X, Y and Z color matching functions.
Measured spectra are tabulated at fixed wavelengths, so every lookup linearly interpolates between the two nearest samples.
Three ways to sample
Fixed buckets. Split the range into m equal bins and evaluate one wavelength per bin, a plain Riemann sum. Cheap and noise-free, but it can step right over a narrow peak, which is exactly what F11 has.
Random Monte Carlo. Pick n wavelengths uniformly at random and average. Unbiased, so it converges to the right answer, but noisy at low sample counts.
Hero wavelength sampling. Draw one random offset, then place a group of 16 wavelengths evenly across the spectrum from it. This is the idea behind hero wavelength spectral sampling (Wilkie et al. 2014): one random number drives several well-spread wavelengths, which stratifies the samples and removes most of the variance of pure random sampling.
// One random offset drives all hero wavelengths
const float offset = RandomSampler::Next1D() * heroStep;
for (int h = 0; h < childSamples; ++h)
{
    float wavelength = Spectrum::WavelengthMin + h * heroStep + offset;
    float LR = LerpAt(luminaire, wavelength) * LerpAt(reflectance, wavelength);
    xyz += LR * glm::vec3(LerpAt(cmfX, wavelength), LerpAt(cmfY, wavelength), LerpAt(cmfZ, wavelength));
}
The dashboard
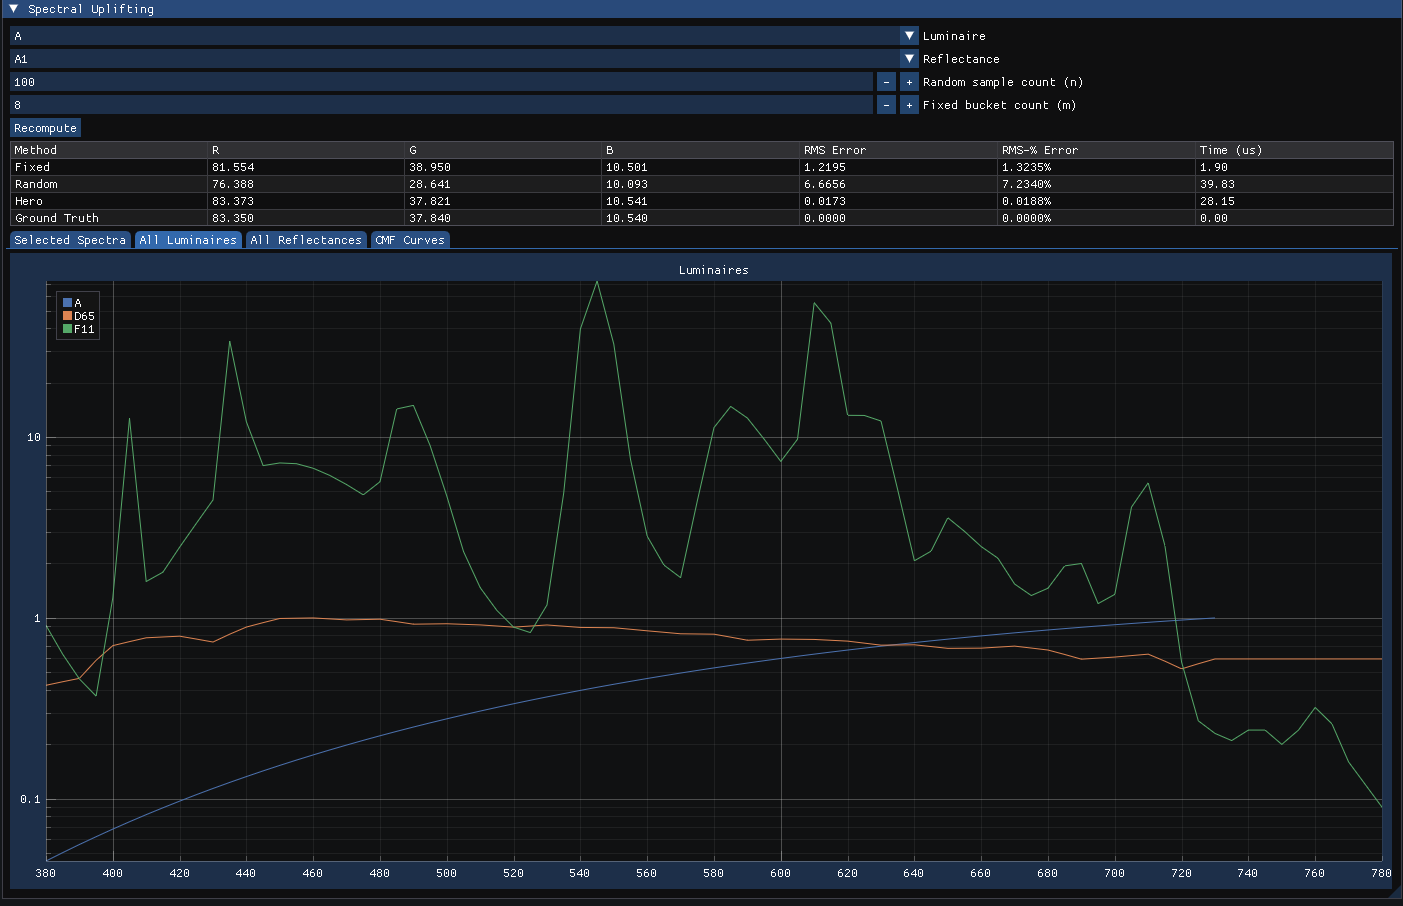
The app is built with Dear ImGui and ImPlot. You pick an illuminant, a reflectance patch, the random sample count and the fixed bucket count, and it recomputes immediately. A table shows each method’s RGB result, its RMS error against a reference value, the error as a percentage, and the time it took in microseconds. Tabs plot the selected spectra, all illuminants, all reflectances and the color matching functions.
In the run shown above (illuminant A, patch A1, 100 random samples, 8 buckets), hero sampling lands within 0.02% of the reference, fixed buckets within 1.3%, and pure random sampling is off by about 7%. Fixed buckets are by far the fastest, so the interesting trade-off appears with spiky illuminants like F11, where a few buckets are no longer enough.
Build
Dependencies are fetched with CMake FetchContent:
cmake -S . -B build
cmake --build build -j
./bin/SpectralUplifting